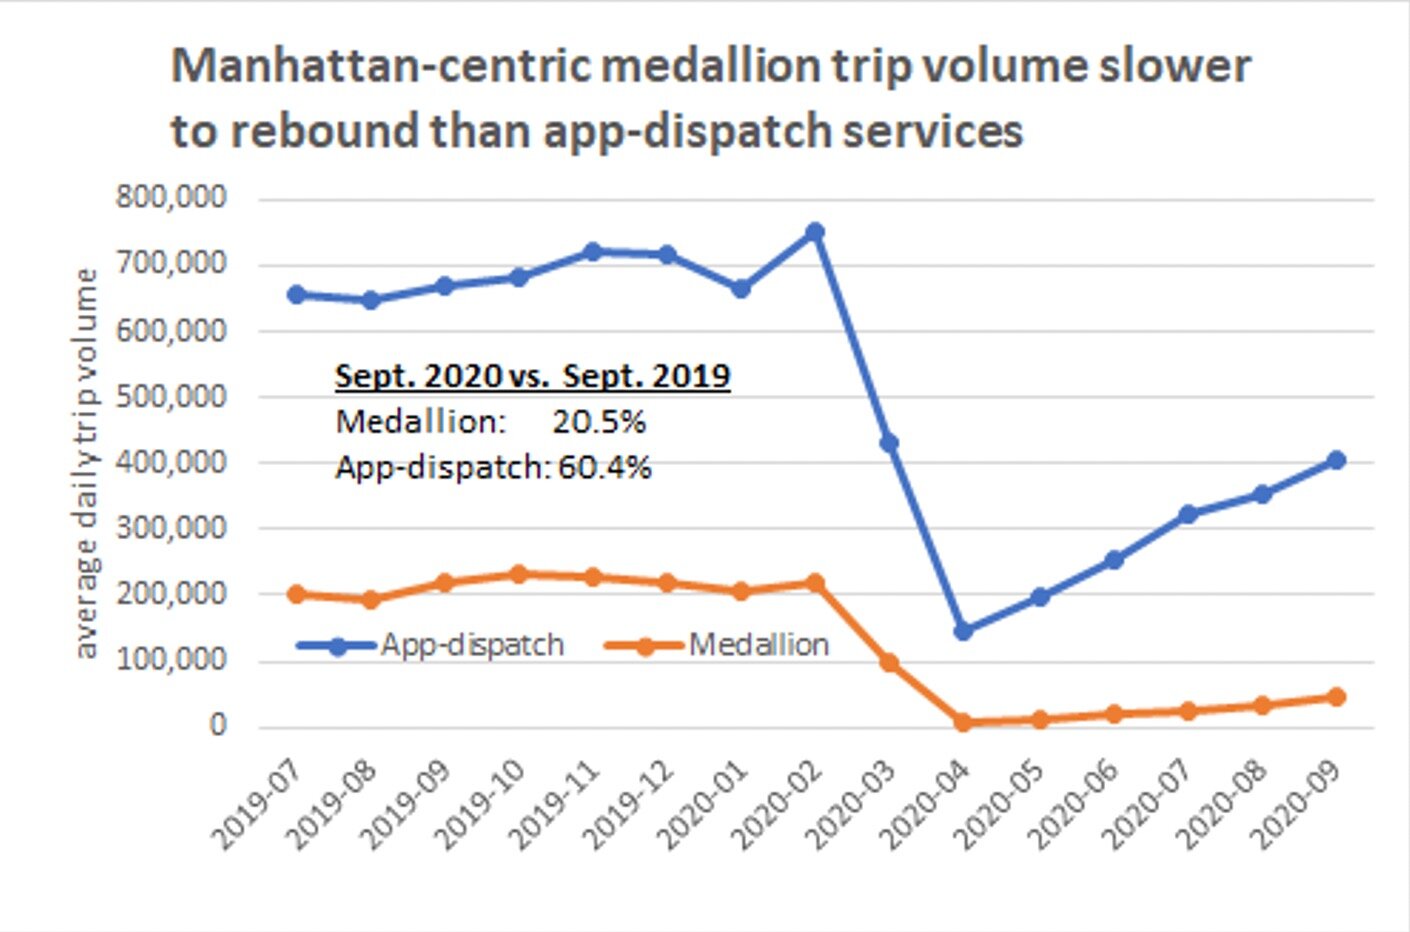
Taxi and app-dispatch trip volume back to 50% of pre-pandemic level, but uneven.
An Oct. 27th front-page story in The New York Times cited our estimate that between 1.2 and 1.3 million New York City residents received unemployment insurance payments in September. Of this number, a little over half are payroll workers receiving regular State unemployment insurance with the remainder, roughly 500,000 workers, receiving Pandemic Unemployment Assistance (PUA). PUA recipients include self-employed and independent contract workers as well as some payroll workers with insufficient base period earnings to qualify for regular unemployment. While we know a lot about the specific industries where payroll jobs have been lost, we know very little about the industries where self-employed or independent contractor workers were working before the pandemic dislocated them.
One of the largest categories of independent contractors in New York City are drivers of medallion taxis or for app-dispatch services Uber, Lyft, and Via. Before the pandemic, there were about 110,000 such drivers, a number that also includes about 5,000 driving green taxis or for traditional black car services. Based on an examination of data provided by the Taxi and Limousine Commission that regulates all taxi and for-hire vehicle drivers, it appears that there were a little over 50,000 drivers out of work in September. As the chart indicates, average daily trip volume for the app services in September was 60 percent of pre-pandemic levels (using September 2019 as the comparison point), while trip volume for medallion taxis was back to about 21 percent of pre-pandemic levels.
At its April low point, app trip volume had fallen by 80 percent and medallion trips had plummeted by 96 percent. On a combined basis, September app and medallion trip volume was 51 percent of last year’s level. The slower medallion taxi rebound is largely due to the absence of office workers, tourists, and art patrons in Manhattan and the sharp falloff in airport traffic.
Undoubtedly, part of the overall trip volume rebound stems from an aversion on the part of many to take mass transit. While the traditional black car and green taxi trip volumes are not shown in the chart (their daily trip levels are a small fraction of those provided by medallion taxis or app-dispatch vehicles), it is interesting to note that the black car business held up better during the worst days of the pandemic. Black car daily trip volume declined to 25 percent of the pre-pandemic level in April and had rebounded to the same degree as app-dispatch services as of July (the latest month for data on black cars). Also, green taxis, which operate in Northern Manhattan and the boroughs outside of Manhattan, have experienced more of a rebound relative to pre-pandemic levels than medallion taxis.
There is also a difference between the app services and medallion taxis in terms of the extent to which the average driver is as busy as before the pandemic. Generally, the app drivers who have returned to work are, on average, doing roughly the same number of trips per hour as before, while the average medallion taxi driver is doing about 20 percent fewer trips per each hour spent driving. As of September, there were 5,700 unique medallion taxi drivers for the month, while there were 50,600 unique app drivers. Not surprisingly, average trip times have fallen from a year ago, with the decline twice as great for the more Manhattan-oriented medallions as for the app services.
This is part of an ongoing regular biweekly Covid-19 Economic Update series prepared by economist James Parrott of the Center for New York City Affairs with the support of the Consortium for Worker Education and the 21st Century ILGWU Heritage Fund.
James A. Parrott is Director of Economic and Fiscal Policies at the Center for New York City Affairs at The New School.


