
Data Brief: Child Welfare Investigations and New York City Neighborhoods
By Angela Butel | June 2019
New York City’s Administration for Children’s Services (ACS) investigated nearly 60,000 allegations of abuse or neglect in 2017—in other words, one investigation for every 30 children under the age of 18 in the city. These investigations were much more heavily concentrated in some neighborhoods than others. Below, we delve into which parts of New York City experience concentrated child welfare activity and which do not. The 10 community districts in New York City with the highest rates of child poverty had rates of investigation four times higher, on average, than the 10 districts with the lowest child poverty. And among districts with similar poverty rates, those with higher concentrations of Black and Latino residents tended to have higher rates of investigation. For a table showing data for all community districts, click here.
Indicated cases are investigations in which ACS finds some credible evidence of abuse or neglect. The data by community district show a correlation between child poverty rate and the rate at which investigations in those districts are indicated. There is not, however, a significant correlation between a neighborhood’s concentration of Black and Latino residents and its indication rate.
ACS does not choose, independently, which families to investigate. As set forth in New York State law, child welfare investigations are sparked by reports of suspected abuse or neglect made to a statewide hotline, the State Central Register (SCR). Reports can be made by anyone, but people in some jobs, like teachers and healthcare professionals, are mandated to report any possible sign of maltreatment. The SCR passes on to ACS any report that, if true, would qualify as maltreatment; ACS must investigate all reports it receives from the SCR. If ACS finds no evidence of maltreatment, the investigation is closed; if any evidence is found, the case proceeds to one of several possible next steps.
Below, we delve into which parts of New York City experience concentrated child welfare activity and which do not. All data are from calendar year 2017, the most recent year for which detailed population data are available, and are aggregated at the community district level. For a table showing data for all community districts, click here.
On the whole, rates of child welfare investigation correlate closely with both child poverty and race. For example, Greenwich Village and the Upper East Side, which have among the lowest child poverty rates and proportions of Black and Latino residents of the city’s 59 community districts, had fewer than 10 investigations per 1000 children. Hunts Point, Morrisania, and Mott Haven, with among the highest child poverty rates and concentrations of Black and Latino residents in the city, each had more than 70 investigations per 1000 children.


As these maps show, there is significant overlap in concentration of child poverty and of Black and Latino residents. However, each factor correlates with investigation rates even when controlling for the other factor.
Community Districts with Similar Child Poverty Rates and Varying Racial Demographics

When controlling for child poverty rate—looking for variation among neighborhoods with similar proportions of children in poverty—we found that those with more Black and Latino residents tended to have higher rates of investigation. Consider three neighborhoods, all with child poverty rates between 15 and 16 percent: Staten Island Community District (CD) 2, which covers the middle third of Staten Island; Brooklyn CD 10, which includes Bay Ridge; and Queens CD 9, which includes the neighborhoods of Kew Gardens and Ozone Park. The Staten Island and Brooklyn CDs both had about 18 percent Black and Latino residents, and had very similar investigation rates: 18 and 17 per 1000 children, respectively. Queens CD 9, with 48 percent Black and Latino residents, had 28 investigations per 1000 children, significantly higher than the other two neighborhoods.
Community Districts with Similar Racial Demographics and Varying Child Poverty Rates

And when controlling for race, we found that neighborhoods with higher child poverty rates also had higher rates of investigation. To illustrate this, the map below shows three community districts: Queens CD 14 (the Rockaways), Bronx CD 8 (Kingsbridge and Riverdale), and Manhattan CD 9 (West Harlem). All three neighborhoods had about 60 percent Black and Latino residents. Queens CD 14 and Bronx CD 8 both had child poverty rates below 30 percent, and had 33 and 21 investigations per 1000 children, respectively. Manhattan CD 9 had a higher child poverty rate—39 percent—and a significantly higher investigation rate at 41 investigations per 1000 children.

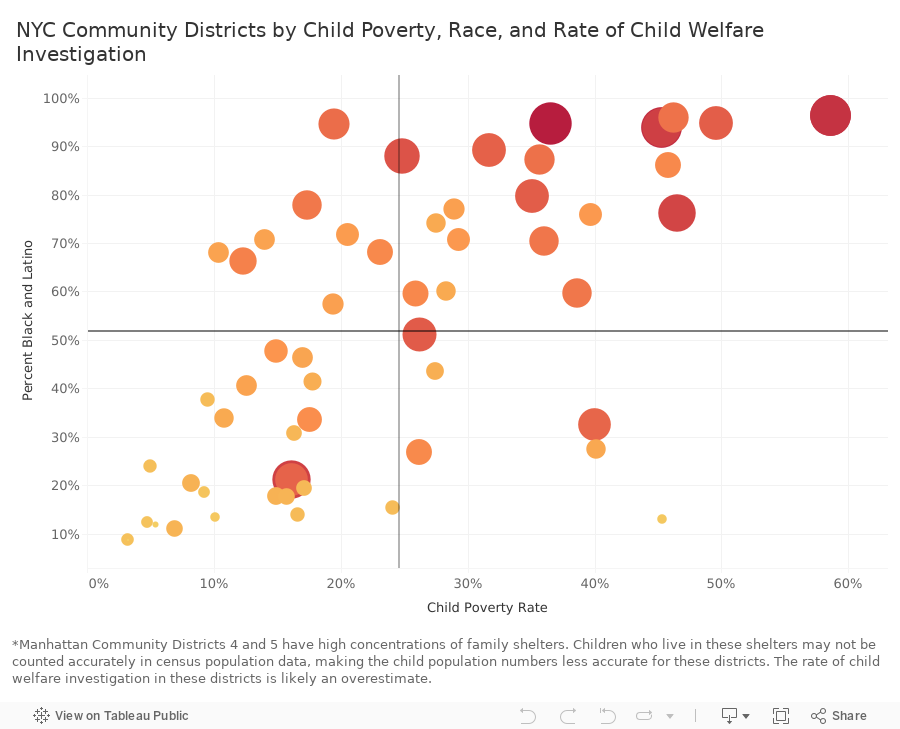
The matrix to the left plots all 59 community districts according to where they fall along the axes of child poverty rate and percentage of Black and Latino residents. The size and color of the dots represent the rate of investigations and make it clear that, on average, having either a higher child poverty rate or higher concentration of Black and Latino residents is associated with higher rates of investigation. Neighborhoods with the most child welfare investigations are those in the upper right, with both high poverty rates and a high concentration of Black and Latino residents. Neighborhoods with the fewest investigations are clustered in the bottom left corner, with low poverty rates and low concentration of Black and Latino residents. The interactive version is below.
Interactive Version
Interestingly, the correlation between a neighborhood’s racial demographics and investigation rate does not extend to indication rate—the rate at which those investigations find some credible evidence of abuse or neglect. Child poverty rate is correlated with indication rate; in higher-poverty neighborhoods more investigations, on average, are indicated. But the pattern among neighborhoods with high concentrations of Black and Latino residents is much less clear, and the trend is not statistically significant.


Why might we see more reporting of families in predominantly Black and Latino neighborhoods but not systematically higher rates of indication? There is long-established acknowledgement of implicit bias in child welfare reporting; mandated reporters such as teachers and medical professionals, as well as the general public, may hold racial biases that make them more likely to report a family of color than a white family under similar circumstances. There is less consensus in the research about whether racial biases persist at the point of indication. The data used for this analysis are at the neighborhood rather than the individual level, so we cannot draw definitive conclusions about the extent of racial bias in indication rates in New York City’s child welfare system. Our findings do, however, suggest possible areas for fruitful future research.
What is clear from this data is that in New York City, child welfare investigations disproportionately affect low-income families and families of color, especially in neighborhoods with high concentrations of both groups. Life is changed for the families involved in these investigations. The effects on these families, and on the broader communities in which child welfare investigations are concentrated, also merit further investigation and discussion.